3. The Science of Flight and the Paradox of Flying Pterosaurs
Galileo's Square-Cube Law plays a crucial role in determining the maximum weight of flying objects, as larger, heavier animals or airplanes require a disproportionately greater amount of power to achieve flight. The largest airplanes must use jet engines because only the most powerful engines can generate enough thrust. Similarly, the largest flying animals today are birds, as their warm-blooded, high-metabolism system provides the required power for flight, whereas bats, with a lower metabolism, are limited to being only about one tenth the mass of the largest birds. Cold-blooded reptiles rank lowest on the power scale and so they cannot fly at all. While some lizards and snakes are called "flying reptiles," they can do little more than glide at a forty-five-degree angle toward the ground.

A size comparison between a typical car and the Quetzalcoatlus.
Today, no reptiles are capable of generating the power needed for flight, yet during the Mesozoic era, reptiles grew to be the largest flying animals that ever existed. The largest of these pterosaurs was Quetzalcoatlus, which had a chest as large as a horse and stood as tall as a giraffe. How Quetzalcoatlus and other pterosaurs managed to fly presents a significant scientific paradox, yet some paleontologists continue to insist that no such paradox exists.
The strongest evidence against this position is that no one has successfully built a radio-controlled model pterosaur capable of flight. Between 1984 and 1986, the Smithsonian allocated $700,000 to aerodynamics expert Paul MacCready to create an RC model demonstrating the flight capabilities of Quetzalcoatlus northropi. However, MacCready's team quickly realized that a full-sized model, with a realistic weight and power, would be incapable of flight. Instead, they built a half-sized model weighing only 44 pounds, which was power-launched high into the air with a stabilizing tail in hopes that it could at least flap its wings and descend gently.
While this model neither truly flew nor accurately represented Quetzalcoatlus in size and weight, paleontologists hoped it would at least give the illusion of flight. However, their plans failed spectacularly on May 17, 1986, when, in front of the national media, the RC pterosaur model unceremoniously dove into the ground and broke its neck. As the newspapers put it, it was a pterrible ptragedy.
This is not a close call - pterosaurs could not have flown in today's atmospheric environment. The application of aerodynamic equations shows that pterosaurs fall far short of meeting the requirements for flight in our present atmosphere, and experimental efforts using RC models provide physical evidence confirming this conclusion. It should be alarming to all scientists and science educators that some paleontologists continue to claim they understand how pterosaurs flew when the evidence so overwhelmingly refutes their claim.
The purpose of this chapter is to investigate the science of flight to understand why pterosaurs would not have been able to fly in today's atmosphere. At the same time, this chapter stands on its own by deriving the Science of Flight Equations, greatly advancing our understanding of flight. Some readers may be primarily interested in the fundamental principles of flight, while others may wish to explore the discussion on animal power to fully grasp the paradox of flying pterosaurs. Those interested in the calculations related to the power required for flight can click the following link: 'Calculating the Animal Power Available for Flight'.
The Science of Flight

Flying Seagull
For centuries man has dreamed of flying, then on December 17, 1903 at Kitty Hawk, North Carolina, a couple of bicycle mechanics turned scientists won the race to be the first to fly. Aviation technology has moved forward dramatically during the hundred years that followed; the jet airliners of today are themselves longer than the first three of the Wright's first four historic flights. And so this rapid advancement in technology might fool us into believing that the aviation experts have a complete understanding of the science of flight when in fact this is not true. The past century's great advancement in aviation technology has largely been achieved through a trial and error process such that the technology has led the science. To further explain, the Wright brothers did not necessarily understand why a particular wing design generated more lift; they just use the wing shape that performed the best in their wind tunnel testing and in the test flying of their gliders. Likewise, a century later aerodynamic engineers still rely on wind tunnel testing and the feedback from test pilots to guide the design of modern airplanes.
After the development of the first airplanes, there was keen public interest in understanding flight. Yet the aviation pioneers didn't have a clear or accurate explanation of flight since the shape of these airplanes had come about more through trial and error rather than through the application of science principles. This awkward knowledge gap eventually led to the Equal Transit Time / Bernoulli's Principle becoming a popular explanation of flight. Unfortunately, even though the Equal Transit Time explanation did the trick of satisfying the public's curiosity of how airplanes fly, it is nevertheless unquestionably wrong.
To review, the Equal Transit Time / Bernoulli's Principle explanation of flight states that the air traveling over the wing must complete its journey in the same amount of time as the air flowing beneath the wing. The statement implies that the two air flows that are divided at the front of the wing are soul-mates of each other such that they must each travel their paths in the same amount of time before uniting at the rear of the wing. This Equal Transit Time statement is needed to apply Bernoulli's Principle that relates the difference in air speed to the difference in the top and bottom air pressure and thus explains how lift is generated on the wings.

The Equal Transit Time statement is complete nonsense. There is no conservation law of physics that requires a divided air flow to be synchronized with each other when they are reunited. Furthermore in wind tunnels, smoke pulsated airstreams flowing around the wing show that the top air stream reaches the back of the wing long before the arrival of lower air stream, and calculations of the pressure difference requirements for achieving lift further confirm that the top air flow must reach the rear of the wing ahead of the lower air flow.
Without the Equal Transit Time statement, Bernoulli's Principle by itself does not help us in explaining flight. In fact, in the application of Bernoulli's Principle the cause and effect are reversed: lift due to the pressure difference is not the result of the air flowing faster over the top wing, but rather to balance this energy equation the air flows faster over the top because the pressure above the wing is lower.
The correct short explanation of flight is that as the air flows over the top wing surface it follows the form of the wing. As the air travels over and past the thickest part of wing, the air is diverted downward as it sticks to the profile of the wing. In the process of the wings diverting a tremendous amount of air down, an upward reactionary force is exerted on the wings of the plane that lifts the airplane up.
Once the key physics concepts are understood, it is possible to derive the equations giving the takeoff speeds and power requirements of any airplane or flying vertebrate based on the object's weight, wingspan, shape, frontal area, and drag coefficient, in addition to knowing atmospheric criteria such as air density. But before getting into the derivation of the Power for Flight Equations, let us begin by listing some of the key conceptual results.
- Airplanes fly by constantly expending energy in the process of throwing air down. Unlike a light gas or hot air balloon that floats in the atmosphere, flying animals and flying machines use power - the expenditure of energy per unit time - in order to fly. While in flight, energy is constantly being transferred to the air in the process of throwing it down. Because air is invisible, this movement of the air is usually not directly or even indirectly observable for airplanes. But certainly when a helicopter hovers over a grassy field we can observe the grass being blown by the wind. Without the constant expenditure of energy these flying machines will lose altitude.
- Wings generate lift by pulling air down. While it may be easier to conceptualize wings throwing the air down by pushing it down, this is not the usual way that wings generate lift. Because air is like most fluids in having viscosity, the air flowing over the top wing surface 'sticks' to the surface and in doing so it is thrown down as it follows the curvature of the top wing surface. While it is possible for wings to generate lift by pushing the air down, pulling the air down generates more lift while producing less drag; so pulling the air down is far more effective than pushing the air down.
- Airplanes need power for both lift and for overcoming drag. Some of the airplane's power is used to transfer energy to the air as it throws the air down so as to lift the airplane up. The remainder of the power is used to overcome the frictional drag force of the air that impedes the forward motion of the airplane. Flying animals and flying machines must have the power to fulfill both of these requirements in order to fly.
- Flying is unique from other means of travel in that the most efficient speed is not the lowest speed. With all forms of travel through a fluid, such as air or water, the power required to overcome drag goes up dramatically with speed. Consequently, the best fuel efficiency is usually obtained by traveling slowly. However, flying has the additional power requirement of generating lift. Interestingly enough, the amount of power required for lift decreases as the airplane travels faster. Since the total power requirement is the summation of the power to overcome drag and the power for lift, the most efficient speed for flying is not the slowest speed but rather it is a speed between the extremes of flying slowly or extremely fast. Consequently nearly all airplanes and flying animals fly within a narrow range of medium speeds where they maximize their fuel efficiency.
- Galileo's Square-Cube Law applies to flying such that the smaller objects take to the air easier than large objects. Because small objects have a greater area to weight ratio, small objects are easily tossed about in a breeze. For example, in the desert grains of sand are easily blown about while there is no chance of the wind picking up the much larger boulders. Likewise it is not much of a challenge for insects to be picked up by the wind and so it was not a great evolutionary leap for so many of these small insects to evolve the ability to fly.
- The larger animals or airplanes require disproportionately greater power to fly. Without wind or updrafts to supply lift, an animal or aircraft must supply its own power to fly. Flying is more of a challenge for vertebrates than for insects because even the smallest flying vertebrate is still larger than nearly any insect. With greater size comes both greater weight and power, but the additional power is not nearly enough to compensate for lifting the greater weight. Flying birds are usually larger than most bats because birds have a higher metabolism and likewise greater relative power. Likewise the largest airplanes are all jet airplanes rather than being piston / propeller airplanes because the higher power output of a jet engine is required to lift the large heavy airplanes off the ground.
- Flying animals such as birds and bats are restricted in size because of their relative power limitations. As one of the consequences of Galileo's Square Cube Law, the relative power of animals decrease as a function of the increasing size of animals. Further hampering the flying ability of large animals is the theoretical aerodynamic results showing that heavier objects need disproportionally more relative power than lighter flying objects. As we look at increasingly larger birds we observe that they are being squeezed between these two physical constraints. Large eagles and vultures need the assistance of rising air thermals in order to soar; a wild turkey is capable of short flights but actually prefers to walk, while the largest birds such as an ostrich are incapable of flight.

The lack of relative strength and power forces the larger birds to soar so as to minimize the flapping of their wings. It is because of the difference in relative strength and power that the largest birds will seek out rising air thermals to stay airborne, while the smallest of birds, the humming bird, can hover and even fly backwards. The difficulty of obtaining flight relative to size is further observed by noting the relative size of the wings compared to size of the body. Compare the small wings of the humming bird compared to its body; contrast this with the extremely large wings that the eagle needs compared to its body.
How Wings Generate Lift

The wings of an airplane lift the aircraft up by throwing a tremendous amount of air down. This basic fact about flying may not be obvious to everyone because air is invisible, so its movement usually goes unnoticed. Nevertheless, evidence of the air being displaced downward can be seen when an airplane flies over a cloud, and in doing so, it creates a trough of clear air cutting through the cloud. Likewise, an airplane flying low over a runway or field will show the result of the downward breeze in the blowing dust and leaves as the airplane passes overhead. How the wings throw the air down is the key to understanding flight.
The first thing to consider is whether wings generate lift by the bottom wing surface pushing the air down or is it the top wing surface generating the lift by pulling the air down. Conceptually it is easier to visualize the bottom wing surface lifting the airplane up by pushing the air down. Essentially this is how a kite flies; the kite is lifted up by the bottom surface of the kite deflecting the wind down.
Many of the early aviation pioneers thought this is how an airplane would fly, so the wings of their aircraft were nothing more than large airtight fabrics that were intended to deflect the air downward as the propeller moved the airplane forward. The idea that the wing surface area equates to lift is a widely held belief even to this day. Aerodynamic engineers still calculate an airplane's wing loading - the weight of the airplane divided by the area of the wing - as if the total surface area of the wings is all that mattered in determining the lift generated by the wings. But generating lift by deflecting air with a large surface is not how an airplane flies.
A major advancement in aviation came when a retired railroad engineer named Octave Chanute incorporated the same Pratt Truss Configuration used on railroad bridges to construct a long wingspan biplane glider. The long wingspan, in addition to the properly curved chambered profile of the wings, produced much more lift than the earlier wing designs that were based on maximizing wing area. The Wright brothers had the success of building the first controllable powered airplane by starting with Chanute's wing as the central component of their design.
A properly cambered wing produces lift by the top wing surface pulling the air down. The wing is able to pull the air down because air has viscosity and so the air sticks to the surface of the wing and thus causes the airstream to follow the wing's profile. This process of pulling the air down produces much more lift than the method of trying to generate lift by using the bottom surface to push the air down.
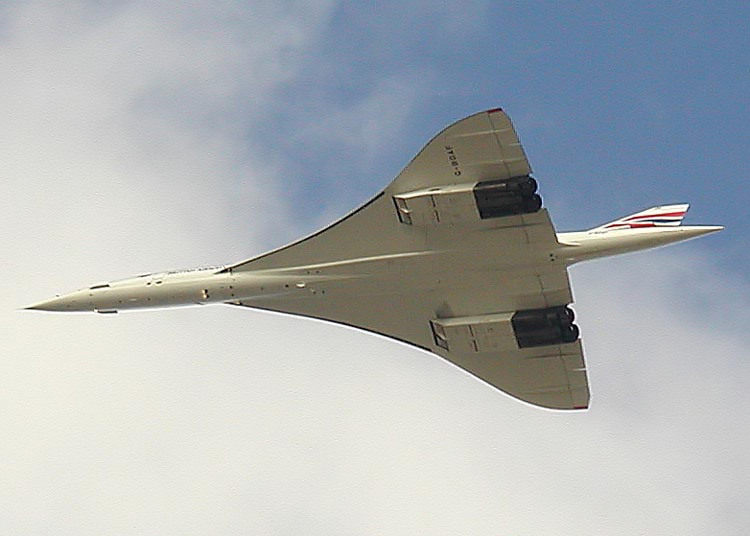
The reason the Concorde Supersonic Transport jet had a delta wing was to slow the airplane down when coming in for a landing.
Pushing the air down is usually not a desirable way to produce lift since doing so produces so much drag and this would tend to slow the airplane down. Thus airplanes do not fly by using the bottom wing surface to push the air down. However there is one exception and that is when an airplane with a delta wing is approaching a landing.
Supersonic airplanes tend to have the greatest difficulty in slowing down to an acceptable speed for achieving a safe landing. Yet by providing these airplanes with a delta wing the pilot can use this large broad surface as a brake for slowing the airplane down as it approaches the runway. By placing the nose of the airplane exceptionally high, the lower wing surface deflect air both forward and down thus both slowing the airplane down while still providing lift for the aircraft. While this 'power stall' type of landing is the preferred means of landing these fast supersonic airplanes, this type of landing is not possible for all other airplanes. This is because the wings of most airplanes are not broad enough for the bottom surface to be effective in providing sufficient lift for a soft controlled landing.
For further evidence that it is the top wing surface that generates the lift during level flight, please take notice that if an obstruction must be placed near the wing it is always placed below the wing rather than above it. While obviously the landing gear needs to be placed below the wing it is conceivable that jet engines or military weaponry could be placed above the wing rather than below the wing. But these objects are not mounted above the wing because any object mounted this way would compromise that portion of the wing's ability to generate lift.

The fluid is diverted to the right because it sticks to the cup's surface.
It is because of a fluid's tendency to stick to a surface that the wings are able to produce lift by pulling the air down. This phenomenon known as the Coanda effect is demonstrated by holding a smooth drinking glass horizontally so that it just touches the lightly flowing water falling from a faucet. Once the water comes in contact with the glass the stream of water follows the curvature of the glass instead of falling straight down.
Likewise the airstream adheres to the surface of a cambered wing. Just as the air flows over the thickest part of the wing, it takes a downward turn to follow the profile of the wing. In taking this turn, a force is being applied on the air pulling it down and, in accordance to Newton's laws, an equal and opposite force is being applied to the wing lifting it up.
The wings need to be properly curved or cambered so as maximize the amount of air being thrown down so as to create the most lift without creating too much drag. The least amount of drag is created when the cord of the wing is directly lined up with the airplane's forward motion. While a direct alignment produces the least amount of drag, a zero 'Angle of Attack' AOA does not produce much lift. For the best tradeoff between maximizing lift without generating too much drag comes when the wings are set at about a six degree AOA. The AOA is set during manufacturing when the wings are attached to the fuselage. During flight, to produce either more or less lift, the rear elevator is adjusted so as to point the nose of the airplane either up or down thereby changing the AOA of the wings.

While occasionally it is necessary to increase the AOA to achieve greater lift, increasing the AOA by an excessive amount can lead to a dangerous condition known as a stall. A stall occurs when the AOA is so high that the airstream breaks free of its attachment to the top wing surface and when this happens the wings lose their lift.
We can use our water flowing from a facet to observe what is happening during a stall. If we place a wing profile so that it touches the stream of water the fluid sticks to and follows the wing profile rather than falling straight down. Now if we turn the wing profile we can further increase how far we divert the water from flowing straight down. However, if we turn our wing too far the water stream breaks free from our model wing surface. This is what happens during a stall except that the air is flowing horizontally rather than water falling vertically. The most likely time when the airstream may break from the wing is when the AOA is high and the airplane is flying slowly.
For the most part, the air acts as if it were incompressible such that far above the wing the air stream to mimic the profile of the wing. Nevertheless, as we go higher above the wing this following of the wing's profile fades until we reach air that is unaffected by the passing of the airplane. Thus, the air that is about half a wingspan above the wing is pulled down much harder than the air that is farther above the wings of the airplane. The point is that as the wings pass through the still air and causes this air to be thrown down, the air is not all being thrown down at the same speed but rather this speed is determined by its location relative to the wing. The air flowing just above the wing is thrown down much harder that the air that is farther above the wing.

Nevertheless, for calculations purposes this is not a problem. As is often the case in physics, we can substitute a simple model to replace this complicated reality that still produces excellent results. In our simple model we will draw an area that is slightly larger than a half circle above the wings (A = 1/2 b2 where b is the wingspan) and say that all of the air flowing through this area is being thrown down at the same speed.
It is important to recognize that the wing's surface area is not included in the equation above. Many aerodynamic equations incorrectly calculate lift based on the surface area of the wings. Obviously the cord - the distance from the front of the wing to the back of the wing - needs to be long enough to create the profile that produces the Coanda effect, but beyond this increasing the wing's surface area by increasing its cord length does not increase the lift produce by the wing. To increase the lift the focus should be on increases the aspect ratio - the ratio between the wingspan and the chord - rather than increasing the wing area. To give an example, if two airplanes have the same wing area yet one has short broad wings while the other has narrow wings that are twice as long as the first, the airplane with the longer wings will generate four times as much lift as the other. It is for this reason that planes such as sailplanes that wish to minimize weight while maximizing lift will have long narrow wings, or in other words, high aspect ratio wings.
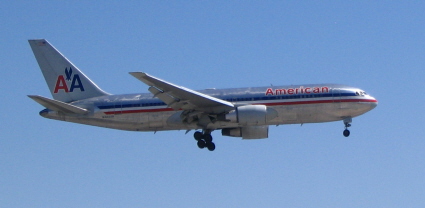
American Airlines jet landing with its flaps down.
This is not to say that airplanes with broad wings are being wasteful. Broader wings enable an airplane to safely fly in rougher weather or at a slower speed without stalling. This is because the broader wing gives the air stream a greater attachment area thus making it more difficult for the air stream to break free of the top wing surface so as to produce a stall. This ability to fly slower without stalling is important to large birds or airplanes when they are taking off or landing. Take note during your next flight on an airliner to observe that the pilot will expand the wings at the early part of approaching the landing. The expansion of the wing lowers the stall speed of the wing and the downward turn of the expansion acts as a brake in reducing the airplane's speed; both of these effects allow the airplane to make a safe landing.
With the correct understanding of the science of flight we can obtain tremendous insight into why the wings of birds or airplanes are shaped a particular way.
In this section the three key concepts to understanding flight are: 1) wings lift an airplane up by throwing a tremendous amount of air down, 2) because air has viscosity it sticks to and follows the top wing surface, 3) in following the top wing surface the air is pulled down and as an equal and opposite reaction the wings are lifted up.
Deriving the Power Required for Lift

As an airplane flies through the air the wings effectively grab the air to throw it down so as to lift the airplane up. The act of throwing air down produces a reactionary force that lifts up on the wings. This upward force on the wings counterbalances the weight of the airplane that is directed downward. Besides these two forces counterbalancing each other in the vertical direction, there is another pair of forces, the drag and the thrust, that counterbalance each other in the horizontal direction. While the airplane is flying along at constant speed and level flight the vector summation of all of these forces is zero.
The idea that an object with zero net force acting on it will continue moving in a straight line is Newton's first law, while the action and reaction forces acting on the wing is an example of Newton's third law that all forces are equal and opposite. What is next needed is the application of Newton's second law of motion for equating the weight of the airplane to how much air the wings need to throw down for the purpose of lifting the airplane up.
Most scholars of physical science are familiar with Newton's second law as being F = m a; when a net force acts on an object its acceleration in the same direction will be inversely proportional to its mass. But while this equation is useful in solving the vast majority of physics problems involving objects, it is not really helpful when we are generating a force by constantly throwing down a fluid. Fortunately Newton actually stated his second law as force being equal to a change in momentum with a change in time: F = Δ(v m) / Δt. By starting with this more general statement we can write Newton's second law applicable to a fluid as F = v dm / dt.
This is the same equation that we would use to describe rocket propulsion. It tells us that we generate the greatest lifting force by maximizing the rate of fluid mass per unit time that we thrown down and we throw that fluid down at the highest speed possible. For our airplane this force is the lifting force acting on the wings that in turn is equal in magnitude to the weight of the airplane so that

American Bald Eagle
W = v (dm / dt)
W is the weight of the airplane or flying animal, v is the downward speed of the air, and dm / dt is the mass of the air being thrown down per unit time.
This flow of mass per unit time is produced by the wings grabbing the air and throwing it down. Earlier it was stated that the cross sectional area of air A grabbed by the wings is about 1/2 b2. Thus
(dm / dt) = ρ dV / dt
(dm / dt) = ρ A (dx / dt)
(dm / dt) = ρ A v
(dm / dt) = ρ (1/2 b2) v
Substituting this into our main lift equation gives:
W = v ρ (1/2 b2) v
Where W is the weight of the airplane, v is the speed of the air being thrown down, ρ is the density of the air, v is the relative speed of the plane through the air, and 1/2 b2 is the effective area A surrounding the airplane affected by the wings as they cut through the air.
This equation tells us that for a greater weight of our airplane and its cargo we can either 1) throw the air down at a faster speed, 2) fly at lower altitude where the air's density is greater, 3) fly faster, or 4) build an airplane with longer wings that are capable of influencing more of the air surrounding the airplane.
Power Required for Lift
Calculating Lift
By substituting lift FL for weight W the level flight lift equation W = v ρ (1/2 b2) v can be rearranged into the form FL = 1/2 ρ v v b2. We can now compare the author's lift equation to the lift equation used by the aviation industry:
Correct Equation for Lift
FL = 1/2 ρ v v b2
Aviation Industry's Equation
FL = 1/2 ρ v2 A CL
The most serious problem with the aviation industry's lift equation is that they calculate lift as a function of wing surface area A. Lift is a function of the wingspan squared rather than the wing area, and this is a lesson that should have been learned all the way back to the success of the very first controllable powered airplane: the Wright brothers' bi-wing Wright Flyer. Because of the errors in the aviation industry's lift equation, a fudge factor called the coefficient of lift CL is required to get their equation to work, and this fudged factor needs to be adjusted for every type of airplane.
As the plane flies through the air, the wings are converting some of the airplanes forward thrust to throwing air down so as to lift the airplane up. This process of throwing the air down requires energy; energy that the airplane gives to the air. The kinetic energy of a moving object is calculate as
E = 1/2 m v2.
Since the airplane is continuously giving this energy to the air it is more appropriate to discuss power, the use of energy per unit time.
P = dE /dt
Substituting the energy equation into the power equation gives:
PL = d(1/2 m v2) /dt
This simplifies to:
PL = 1/2 (dm / dt) v2.
The mass flow rate (dm / dt) was calculated earlier as
(dm / dt) = ρ (1/2 b2) v
and we can use the final equation of the last section to solve for the speed that the air is thrown down as:
v = 2 W / ρ b2 v.
Making these substitutions gives the power needed for lift based on known values:
PL = W2 / (ρ b2 v).
Where PL is the power needed for lift, W is the weight of the airplane, ρ is the density of the air, b is the wingspan, and v is the speed of the airplane. This equation gives us great insight into the fundamental requirements for flight, yet we are still not finished since we must also account for power required to overcome the fluid drag.
Deriving the Minimum Power for Takeoff
In addition to the power being used by the wings to lift the airplane up, power is also required to overcome the parasitic drag. For most large high speed objects moving through a fluid the parasitic drag can be accurately modeled as:

F22 Raptor fighter airplane in flight
FP = 1/2 A C ρ v2.
Where FP is the parasitic drag, A is the front facing or cross sectional area, C is the aerodynamic drag coefficient, ρ is the density of the fluid, and v is the object's relative speed through the fluid.
The general equation for power is
P = F v
So the power needed to overcome the parasitic drag is:
P = 1/2 A C ρ v3
This equation shows that the power requirements go up dramatically with an increase in speed. Therefore if the intend is to travel fast then all effort should be made to streamline the object, reduce its thickest cross sectional area, and if possible travel through a low density fluid. The reason fast cars, trains, and jets look fast even while stationary is due to the necessary of streamlining the form so as to reduce the power needed to reach the fastest speeds.

Because the density of water is so much greater than that of air, submarines travel much slower than airplanes.
Flying is the exception from most forms of travel in that a jet airliner has a means of reducing the density of fluid that it is traveling through. The density of air decreases with altitude. A primary reason that jet airliners fly at high altitude is so that they are flying through air that has a density that is about one fourth the density of air at sea level. By flying through lower density air the airliners reduce their power requirements and achieve savings by getting better fuel mileage. To make a comparison, despite a submarine's extremely good streamline form it can not travel nearly as fast as a jet airliner because the density of sea water is two or three thousand times greater than the density of high altitude air.
Flying is also different from other forms of travel in regards to the various speeds that they can travel. While other forms of travel can move as slow as they like, an airplane is restricted to flying at speeds above its stall speed. Not only is flying well above the stall speed necessary for safe flying it is also best to always fly fast so as to produce the best fuel mileage. Eventually though because the power used to overcome drag is a function of the speed cubed, even for airplanes there is a limit to how fast they can fly and still be fuel efficient. For airplanes there is a sweet spot between flying too slow and flying too fast where the airplane gets the best fuel efficiency.

Starting with the figure on the left, the power required to lift the airplane goes down as the airplane flies faster. In fact an airplane can only fly so slowly before it will stall; this part of the graph is shown with a dash line. The center graph shows power output required to overcome the parasitic drag increases with the cube of the speed. The addition of the power required in overcoming drag and the power required for lift gives the total power needed to fly. This is shown by the graph on the right. Number 1 is the minimum power required for flight. Airplanes and flying animals actually need to fly faster than this speed, to the right of point 1. Number 2 marks the cruise speed.
We can calculate the minimum power speed by summing together the two power requirements and then taking the derivative of the total power requirement with respect to speed. The total power is:
PT = PP + PL
PT = 1/2 A C ρ v3 + W2 / (ρ b2 v)
Taking the derivative of the total power equation with respect to speed then setting the result equal to zero, we determine the speed for minimum power:
![v_min = [(2 W^2) / (3 A C b^2 ρ^2)]^1/4](flight_eq21.gif)
The minimum power can now be determined by substituting this minimum power speed back into our total power equation. Yet when we do this we notice that at this speed the minimum power for lift is 3/4 of the total power. Thus we can simplify our minimum power equation to be:
![P_T-min = 4/3 [ W^2 / (b^2 ρ v_min)]](flight_eq22.gif)
Esker's Equations of Flight are relatively simple equations that give the minimum take-off speed and minimum power requirements to achieve flight based on the atmospheric density and known data of any given airplane. These equations are general to all types of airplanes and flying vertebrates.
If we continued building on the concepts presented so far we can derive a general relationship for how the power requirements increase with size. The general equation is:
Thus we see that as the size of our planes increase our power requirements increase dramatically. As an example of using this power equation we can compare a Cessna 172 to a 747 jetliner. A Cessna 172 is 8.25 m long and has a 120 kW engine, so in applying our equation to the 41 m 747 we get a ballpark power requirement of 42 MW. The actual power of a 747 is about 50 MW.

Historic Picture of the Wright Brother's First Flight
To produce accurate answers when applying this equation our flying objects should be of approximately the same shape and overall density. Yet as the example demonstrates the equation can produce reasonably accurate values for the required power even when our flyers are not that similar. For example, based on the power requirements of the Cessna 172 we could also use this equation to calculate the approximate power requirements of a sparrow or a housefly.
Yet regardless of our fondness for theoretical work, it is all worthless if it is not verified by the evidence. To test the equations the author has selected an assortment of airplanes and flying animals and then used the known data regarding these flyers weight and form as input to calculate their flight performance. When tested these equations not only prove themselves to be accurate, but in addition the equations are able to provide insightful answers to some historical aerodynamic controversies. The reader is encouraged to select their own airplanes or animals to do their own testing to validate Esker's Equations of Flight.
In the table below a power ratio of 1.0 is the minimum requirement for a airplane or animal to takeoff in ideal weather conditions. While a power ratio of around 2.2 and above allows a airplane or animal to fly at its best efficiency per distance along with giving it a safety margin for flying in foul weather.
Flying Ability of Various Airplanes and Animals
Link to the Explanation of Raw Data and a Sample Calculation
| Flyer | Weight (N) |
Front Area Estimate (m2) |
Drag Coefficient Estimate (Front Area) |
Wingspan (m) |
Takeoff Speed (m/s) |
Minimum Power (kW) |
Available Power (kW) |
Power Ratio |
|---|---|---|---|---|---|---|---|---|
| Wright Flyer | 3340 | 1.7 | 0.50 | 12.3 | 14 | 5.7 | 6.3 | 1.1 |
| Sopwith Camel | 6500 | 2.8 | 0.50 | 8.5 | 21 | 30 | 97 | 3.2 |
| Spirit of St. Louis | 23000* | 3.0 | 0.20 | 14 | 37 | 76 | 116 | 1.5 |
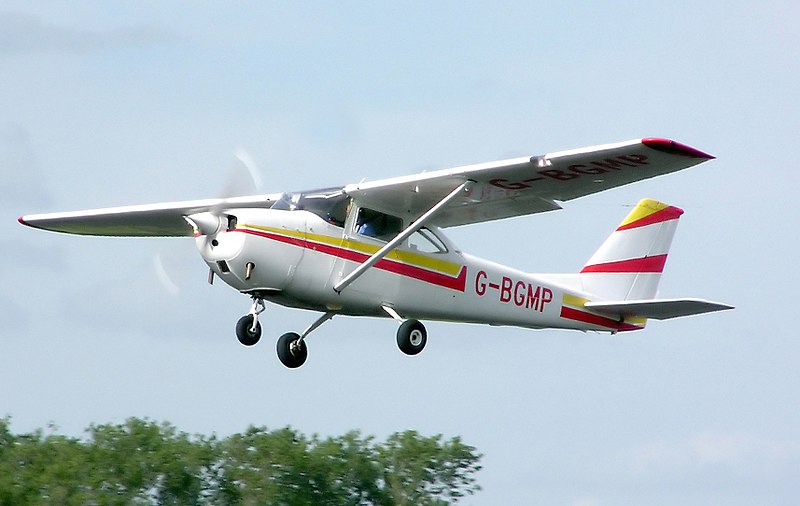
| Cessna 172 | 10900 | 4.0 | 0.17 | 11 | 28 | 37 | 84 | 2.3 |
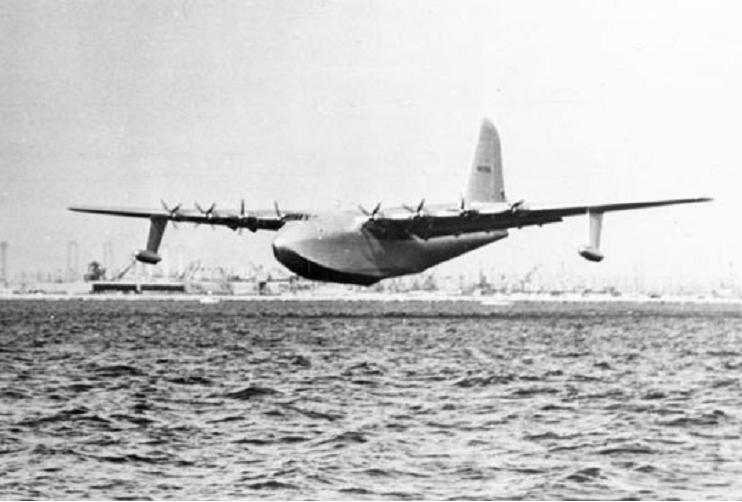
| Spruce Goose | 2300000 | 110 | 0.17 | 97.5 | 60 | 9900 | 13000 | 1.3 |
| Human Flight | 980-610 | 1.7 | 0.12 | 23.2 | 7.8 | 0.24 | 0.29 | 1.2 |
| Starling | 0.74 | 0.0080 | 0.20 | 0.36 | 5.8 | 0.00077 | 0.0051 | 6.6 |
| Giant Bat | 11.8 | 0.070 | 0.50 | 1.5 | 5.2 | 0.013 | 0.021 | 1.6 |
| Condor | 102 | 0.19 | 0.20 | 2.9 | 11 | 0.12 | 0.13 | 1.1 |
| Argentavis | 1400 | 1.1 | 0.20 | 7 | 17 | 2.5 | 0.77 | 0.3 |
| Quetzalcoatlus | 7000 | 2.5 | 0.50 | 12 | 18 | 20 | 1.8 | 0.09 |
Comments Regarding Each Flyer
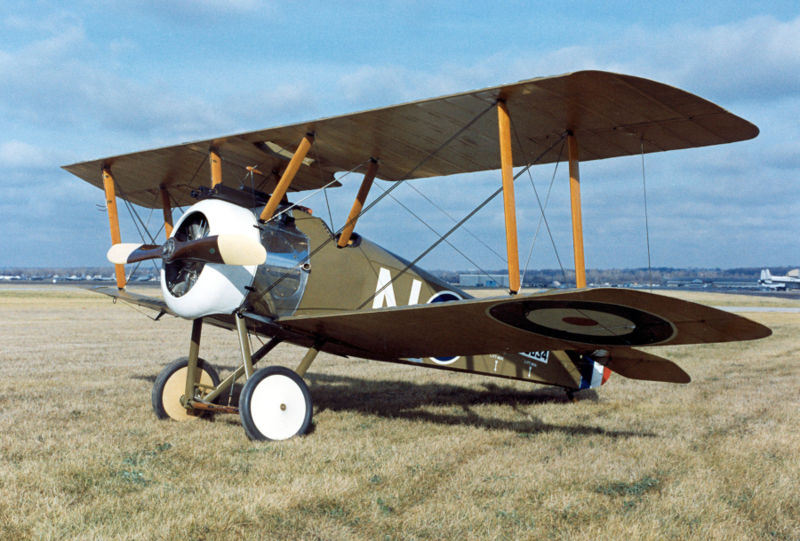
Wright Flyer - The bi-wing Wright Flyer is not much different from the bi-wing World War One Sopwith Camel. Yet the performance characteristics are dramatically different because the Wright Flyer is underpowered: it had only a 12 hp engine.
Sopwith Camel - WWI Fighter Aircraft
Calculations based on the historical data show that the overland speed of the Wright Flyer was only about 4 or 5 m/s even though the least power speed of the Wright Flyer is 14 m/s. The explanation for the difference is that the Wright brothers flew their airplane into a strong headwind as all airplanes do when they takeoff. The Power for Flight equations predict that at least a 10 m/s headwind was required to be added to the Wright brothers' 4 m/s overland speed to give the Wright Flyer the 14 m/s relative speed it needed to fly, and sure enough a check of the historical weather data states that the top wind speed on December 17, 1903 was 22 mph or 10 m/s. The brothers from Dayton, Ohio specifically chose to do their flying at Kitty Hawk, North Carolina because of its record of steady, strong winds.
Sopwith Camel - With a 3.2 power ratio the world war one Sopwith Camel was a surprisingly strong flyer. Learning to fly this tricky airplane was a dangerous undertaking. Besides being fitted with many new and hardly tested components the Sopwith Camel had a spinning rotary engine that gave the airplane unexpected movements while making turns or adjusting the pitch. There were more lives lost learning to fly this airplane than the lives lost in combat.
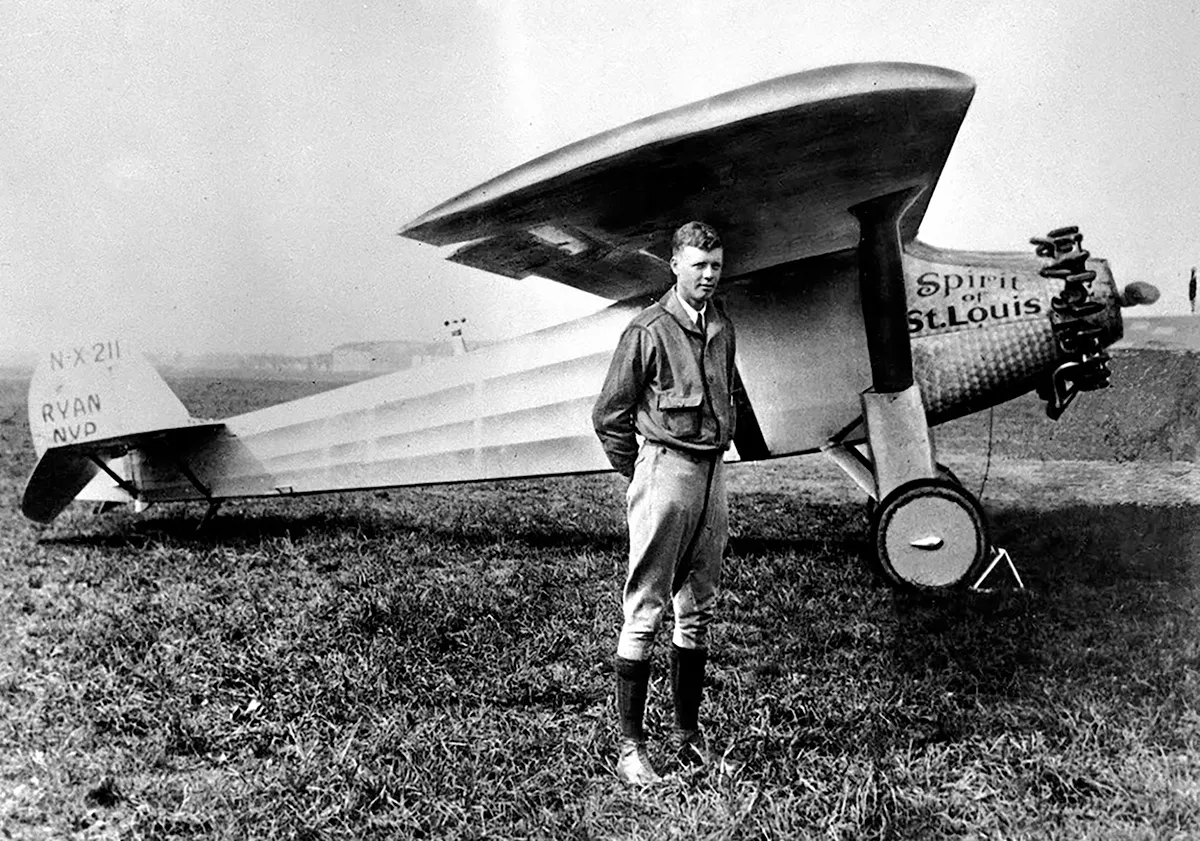
Charles Lindbergh and the Spirit of St. Louis
Spirit of St. Louis - On May 20 and 21, 1927 Charles Lindbergh made history by flying non-stop from New York to Paris to win the $25,000 Orteig Prize. The greatest challenge for completing this task was the 5840 km (3630 mile) distance that required the airplane to takeoff with so much fuel that the fuel weighed more than the unloaded airplane. Before Lindbergh’s success, six of his competitors had died and four of these fatalities had occurred because their overloaded airplanes failed to climb while attempting to takeoff. Lindberg nearly suffered the same fate: loaded with fuel the Spirit of St. Louis had a marginal power ratio of 1.5 and a minimum takeoff speed of 37 m/s, and because of this Lindbergh almost failed to clear the electric power line beyond the end of the runway.
Charles Lindbergh used his practical understanding of airplanes to specify the design of his airplane. It was a good design except that the pilot had no forward view of where he was going. In addition, as the airplane flew to Paris it used up it’s heavy fuel in the forward portion of the fuselage. This caused it to be a lighter and stronger flyer and yet a bit unstable as its center of mass shifted slightly towards the rear of the airplane. Lindbergh talked about how this instability helped to keep him awake as he neared the end of his thirty three hour flight.
Cessna 172 - Recreational Airplane
Cessna 172 - This classic four seat recreational airplane has a 2.3 flying ratio. This 2.3 flying ratio is well above the 1.0 absolute minimum thus indicating that the Cessna is a reasonably safe flyer even if a pilot is caught in less than perfect flying conditions.
Historic picture of Hughes H-4 Hercules that is otherwise known as the Spruce Goose.
Spruce Goose - How much does it actually weigh is the key to answering the Can it really fly? question. Depending on the source, its empty weight is either 300,000 or 400,000 lbs (1.3 to 1.8 MN). It seems odd that this key data is not precisely known. It is also odd that the stated cargo weight of either 100,000 or 130,000 lbs does not correspond with the calculated cargo weight. Seven hundred and fifty men at 200 lbs each gives us 150,000 lbs for the cargo. But if we are going to fly over the Atlantic then the airplane also needs 12,500 gallons or 70,000 lbs of fuel for a total of 220,000 lbs. So depending on which empty weight is correct, its full weight is either 520,000 lbs or 620,000 lbs. Expressed in metrics its full fuel and cargo weight is 2,300,000 N to 2,800,000 N.
Loaded with cargo and fuel its power ratio is only 1.1 to 1.3 thus indicating that the Spruce Goose had only half as much power as what it needed. During the design of the Spruce Goose, Howard Hughes and at least one consultant disagreed on if the Spruce Goose exceeded the limitation of how large a propeller driven airplane could be. But at that time there were no simple equations for determining the power to weight limitation or if a size limitation even existed; so Howard was undeterred in his goal of building an exceptionally large airplane.

Michelob Light Eagle Daedalus Human Powered Flight
As a cargo plane completed too late to fulfill its war-time mission and, more important, lacking the power to carry a cargo the Spruce Goose was not a useful or safe flyer. Yet the Spruce Goose is a historical icon and the numerous engineering challenges that were solved during the design and construction of this extremely large airplane did advance aviation technology.
Human Powered Flight - Two values are given for the weight; the 980 N is the total weight of both man and airplane while the 610 N is the weight of just the man. The total weight is used for calculating the airplane's performance while the weight of the man is use to calculate the power available.
The performance numbers show that human flight aircraft are clearly built around the limitation of a top athlete being capable of producing only about 290 watts. With only a 1.2 power ratio it is probably safe to state that ground effect is a significant factor in enabling these airplanes to fly.
Human powered flight can be achieved only by keeping the weight of both the athlete and the airplane to a minimum while extending the wingspan out as far as possible. Minimize the front facing area and minimize the drag coefficient is helpful yet of secondary importance to the weight, power, and wingspan criteria.
Comparing Calculated Speed for Least Power to Actual Takeoff / Stall Speed
| Flyer | Calculated Speed (m/s) |
Takeoff Speed (m/s) |
|---|---|---|
| Cessna 172 | 28 | 27 |
| Sopwith Camel | 21 | 21 |
| Wright Flyer | 14 | 14 |
| Spruce Goose | 60 | 60 |
| Human Flight | 7.8 | 7.5 |
| Boeing 747 | 96 | 80* |
Starling - With an 6.6 power ratio flying is a not a challenge for these and other small and medium size birds. With such an abundance of relative power it is no wonder that small and medium size birds often appear playful as they fly.
Giant Bat - Giant bats have a power ratio of only 1.6. This marginal power ratio explains why the largest bats are rarely ever seen flying in the rain.
California Condor - This is another extremely marginal flyer that can only fly when the weather conditions are favorable. A 1.1 power ratio is barely enough to allow these large birds to lift off after feasting on a carcass. But once they lift off they glide themselves over the rising air thermals that act like a rising elevator to lift them higher. Once they are soaring, these large birds require only enough power to guide their flight over the rising air thermals.
Argentavis - Six million years ago there existed an extremely large bird known as the Argentavis. It flew in South America like the modern large flyer the Andean condor. However the wingspan of the Argentavis was two and a half to three times that of the Andean condor. Its mass would be proportional of the wingspan cubed and so its mass would have been 16 to 27 times greater than the Andean condor. This places it far beyond the modern crowded field of bird species competing for the title of being the largest flying birds. Consequently many scientists investigating this matter are baffled in their attempts to explain how the Argentavis flew.

Forces acting on a pterosaur when it is in steady constant velocity flight.
It is probable safe to assume that these ancient relatives of the California condor utilized the warm rising air thermals in same way as the large soaring birds of today. Thus the power ratio of 1.1 for the California condor should be seen as the cutoff value for birds using thermal assisted flying. Yet these birds have a power ratio of only 0.3. So even with the assistance of rising air thermals this animal could not have flown in today's atmospheric conditions.
Quetzalcoatlus - Unlike the Argentavis there are no living relatives of the Quetzalcoatlus and this makes it difficult to estimate the Quetzalcoatlus' mass. The author produce values that fell in a range between 500 kg to two tons; thus arriving at a rough estimate of 700 kg. With a 12 m wingspan and a chest cavity larger than that of a horse there is no getting around the fact that this was a huge animal.
However some paleontologists tell a different story in estimating the Quetzalcoatlus mass to be between 90 and 250 kg. Thus they are claiming that the Quetzalcoatlus had a body density that was about seven times less than any animal presently flying. These paleontologists need to do some explaining as to how the muscle, bone and other bodily parts of a Quetzalcoatlus could have a density seven times less than what is found in present day birds.
Some paleontologists have suggested that the pterosaurs may have been warm-blooded. While warm-bloodedness is unusual for reptiles this is nevertheless a feasible hypothesis and so the available power for the Quetzalcoatlus is calculated using the power-to-weight equation for a warm-blooded mammal. Even so, the power ratio of the Quetzalcoatlus is still only nine percent of the minimum requirement for flight.
So how did the Argentavis and Quetzalcoatlus fly? The answer is in the equations:
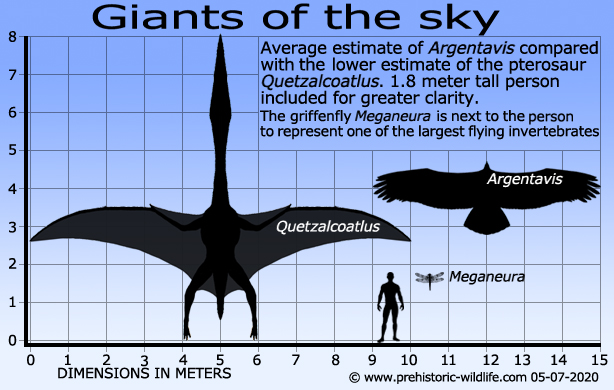
Size comparison of Quetzalcoatlus and Argentavis
Image provided by Prehistoric Wildlife
In these equations the density of the air is the only variable that is not a property of the flying animal, and so this is the only variable that could have change so as to explain the existence of much larger flying animals millions of years ago. If the air density is different then this will change the takeoff velocity and minimum power required for flight. For example, if the air were a hundred times thicker then the takeoff velocity and the minimum power would both be reduced to being ten times less. Both the lower takeoff speed and the lower power requirement are critical towards giving large animals the posibility of flight. The lower takeoff speed is necessary since large flyers have an extremely difficult time running fast enough to match their minimum takeoffs and landings speeds, and the low power requirement for flight is needed since these larger animals have much lower relative power and strength than the smaller animals.
If you are still confused as to how the Argentavis and Quetzalcoatlus flew then just read on to the next chapter, the chapter that searches and finds the solution to the paradox of gigantic birds, pterosaurs, and dinosaurs.
*If at the beginning of this chapter on flight you passed over the link to the discussion of animal power, this would now be a good time to read this section to fully understand the relationship between animal power and the power required for flight.

External Links / References
Pterosaurs
- pterodactyl was so big it couldn't fly - Chatterjee
- Introduction to the Pterosauria - U. C. MUSEUM OF PALEONTOLOGY
- New Discovery of Pterosaurs with 18m Wingspan - BBC NEWS
- Quetzalcoatlus Northropi - BIG BEND NATIONAL PARK
MacCready's Attempt to Show that Pterosaurs Could Fly
- Electronic Flying Lizard - Las Angeles Times
- The Great Pterodacty Project - Paul MacCready
- PTEROSAUR NEARS FIRST ATTEMPT AT FLIGHT - - New York Times
- MODEL PTERODACTYL TAKES TO AIR - New York Times
- Macreadys Pterosaur PR Disaster
How Wings Generate Lift
- Airfoils and Airflow - John S. Denker
- How do airplanes fly, really? - THE STRAIGHT DOPE
- Bernoulli Versus Newton Explanation of Lift - NASA
- Why does the air flow faster over the top?
Science of Flight
- Aircraft Flight Dynamics - Robert F. Stengel, Princeton University
- Dynamics of Airplane Flight - ABOUT.COM
History of Airplane Flight
- Evolution Of The Airplane - Simply Flying
- History of Aviation - First Flights - avjobs
- Brief Timeline History of Manned Flight - Flying Boat Museum
Data on Airplanes
- Original Spirit of St. Louis Construction Data
- The Spirit of St. Louis’ Amazing Journey - Smithsonian
- Man's Greatest Flight - MIT
- 1903 Wright Flyer - Wright Brothers Aeroplane Company
- Airliner Takeoff Speeds - Jeff Scott
- Sopwith Camel - Larry Dwyer, Aviation History On-Line Museum
- Cessna R172K
Newton's Laws: F = m a
Drag Coefficient
- Drag - Southern Methodist University
- Drag Coefficient - Eric Weisstein's World of Physics
- Drag Coefficient -Autopedia
- Drag Coefficient - NASA
- How drag affects the flight of a baseball - Matthew West
Fluid Dynamics
Spruce Goose
- Spruce Goose - Mike Neely
- Spruce Goose - Michael King Smith
- How come the Spruce Goose flew only once? - Cecil Adams
Wright Flyer
- Virtual Museum of Pioneer Aviation - Wright Brothers Aeroplane Company
- Wright Flyer Model with Historical Account
Human Powered Flight
- Human-powered Aircraft Competition in South Korea
- Video Showing Human Powered Flight -
- Ten Human Powered Aircraft - Hushkit
- Human Powered Flight - SKYTEC ENGINEERING
- Human Powered Flight Competition - Popular Mechanics
Science of Flight Applied to Birds
Difficult Takeoffs and Landings of Large Birds
Videos On How Wings Generate Lift
Comments, Questions, and Answers
Selected comments and questions are given with the permission of the parties involved.
The reason I wrote chapter three where I derived the equations of flight is because aerodynamic experts were not being clear in giving equations answering the most fundamental question of whether something had the proper wings and power capacity to enable it to fly. In other words, for the straight forward question of whether a plane or animal was capable of flight there was no relatively simple theory / equation giving a clear yes or no answer. Because of this the paleontologists had the freedom of making up all sorts of BS regarding the flight ability of pterosaurs with no one from the aerodynamic community coming forward, for the sake of science, to refute their statements as being misleading.
While I am pleased with the results of my work, I will be the first to admit that there is still much that I do not know on the subject of aerodynamics. Fluids dynamics / aerodynamic is such a rich and complex field. And because it is so complex, I felt that if I were to constantly go into all the fine details that I too would lose sight of the goal of giving a clear clean theoretical explanation of what are the essential requirements for achieving flight. Of course there is much more details that could be stated but if I did so I believe that most people would fail to get through all of the reading rather than recognizing that it is possible to understand flight.
David Esker
Dear Mr Esker,
I am a retired (Dutch) aeronautical engineer, with industry practice for several years in an Airbus and Fokker aeronautical design department. Later I switched career and the last 30 years I taught airline pilots the theory of flying, engines and systems. Currently I got interested in pterosaur flight and consider to write a (popular) book about them. Within that context I stumbled over your website dedicated to dinosaurs and pterosaurs in particular. I also saw you fresh approach concerning the aerodynamic theory.
In the first place I have to tell you that I was flabbergasted by your opening statements, in the positive sense. Your approach is exactly how we handled it in our aeronautical training for young pilots. Many of them knew the theory as you rightly criticize. Like you we told them that the flow at the wing upper side reaches the trailing edge before the flow at the wing underside. And your remark that lift is due to the action-reaction principle and that Bernoulli is following, is spot on as we always taught it. I have until now never met someone who taught this as we did, so here I am completely at your side.
I am very interested in your analyses of the power generated by birds, bats and pterosaurs, but I am no specialist in that, so I can merely accept what you state there. The main reason however why I decided to write you this email, is your conclusion that the reason why such giants as that pterosaur, whose name I cannot memorize, but I am talking about the biggest one, ever could take air on their own power is the possibility of a much higher air density. I cautiously came to the same conclusion and was very surprised that non of the specialists on pterosaur aerodynamics mentions this as a possibility. I came across a simple remark concerning this in the ph d thesis of Mr ______ at Stanford, where he investigates optimal flapping flight of pterosaurs. He calculates his whole work for the present day atmosphere, but does mention a density of up to 6 times the present value during the Mesozoic and investigates as a kind of side line the influence of this density increase. His conclusion is that the power required would be much less, but no other remarks on this topic. I think, apparently with you, that this is the whole thing that does it.
I did however compared your model to the main stream ideas, just to see how it stands. So I used the idealised drag formula CD=CD0 +CL^2/( .A.e), A being the aspect ratio and e the efficiency factor expressing the efficiency in reaching an elliptic lift distribution. I used as well as I could the numbers you supplied, but of course I had to come up with my own values for CD0, e and mean chord. The CD0 I have devised based on the value you gave for C.
My formula for the minimum power speed then becomes: Vmin=(4W^2/(3?^2p.e.CD0.b^3.cmean))^(1/4).
And the minimum power is, just like in your case 4/3*power due to lift (in my case called power due to induced drag). Pmin=8*W^2/(3?.b^2.p.e.Vmin*1000) in kW
I have worked out all cases that you published on your website. In all cases I took the density to be 1.225 kg/m3. Where possible I used your numbers. Of course I had to supply numbers for the variables that you do not use. The mean chord (c-gem) I found on the internet in some cases, in other cases I had to guess a little. But they were educated guesses. The value for CD0 I calculated from your value C, but re-worked them so that they matched the wing area, which is the reference area for the main stream aerodynamics. The value for e was a wild guess in every case, just reflecting my idea of an efficient wing planform.
At home I have a computer program that can calculate the value for e, given a planform without wing twisting. When I am home I shall try to find it and correct the e values where possible. Of course mainly the animals did not have nice tapered wings, that the program uses, but we can give it a try. In general the power I found was clearly lower than your values.The values for optimum speeds were closer. I am curious about your comments in this before I switch to your side.
You tell me that you have made an aircraft design based on your new aerodynamics. I wonder what the design difference might be. All I see until now is a difference in estimated power. I fail to see how that may result in a radical new design, but you can surprise me.
Best regards,
Peter
January 2017